Configure service discovery rules
Observable Insight supports the way of creating CRD ServiceMonitor through container management to meet your collection requirements for custom service discovery. Users can use ServiceMonitor to define the scope of the Namespace discovered by the Pod and select the monitored Service through matchLabel .
Prerequisites
The cluster has the Helm App insight-agent installed and in the running state.
Steps
-
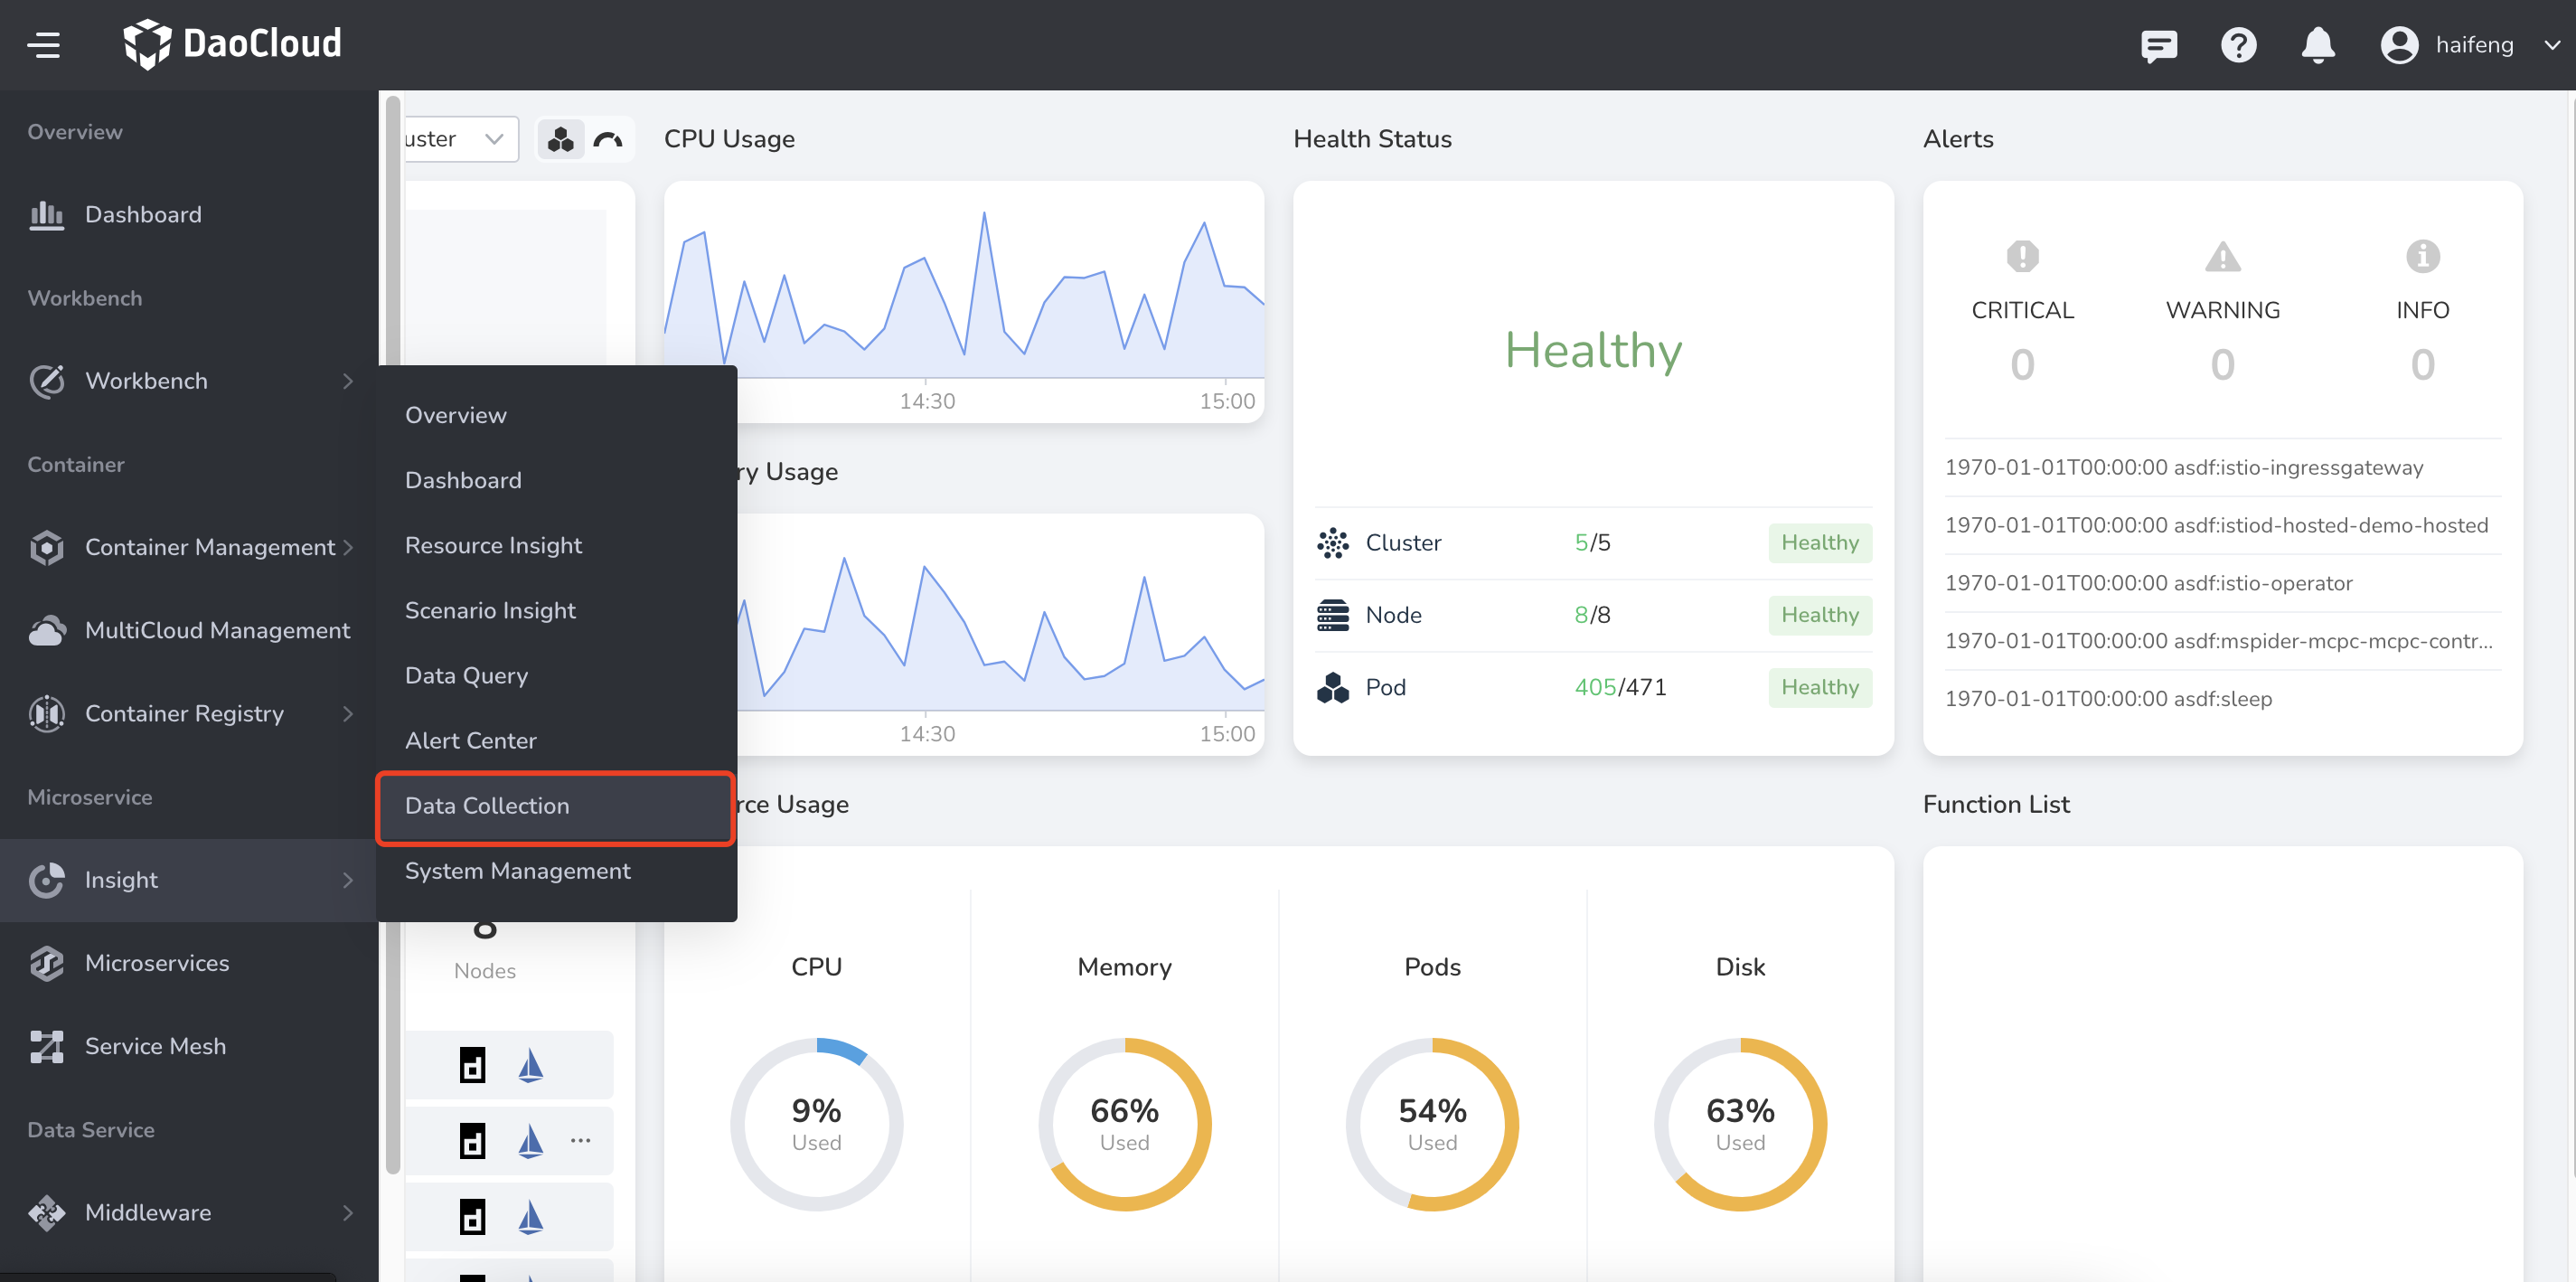
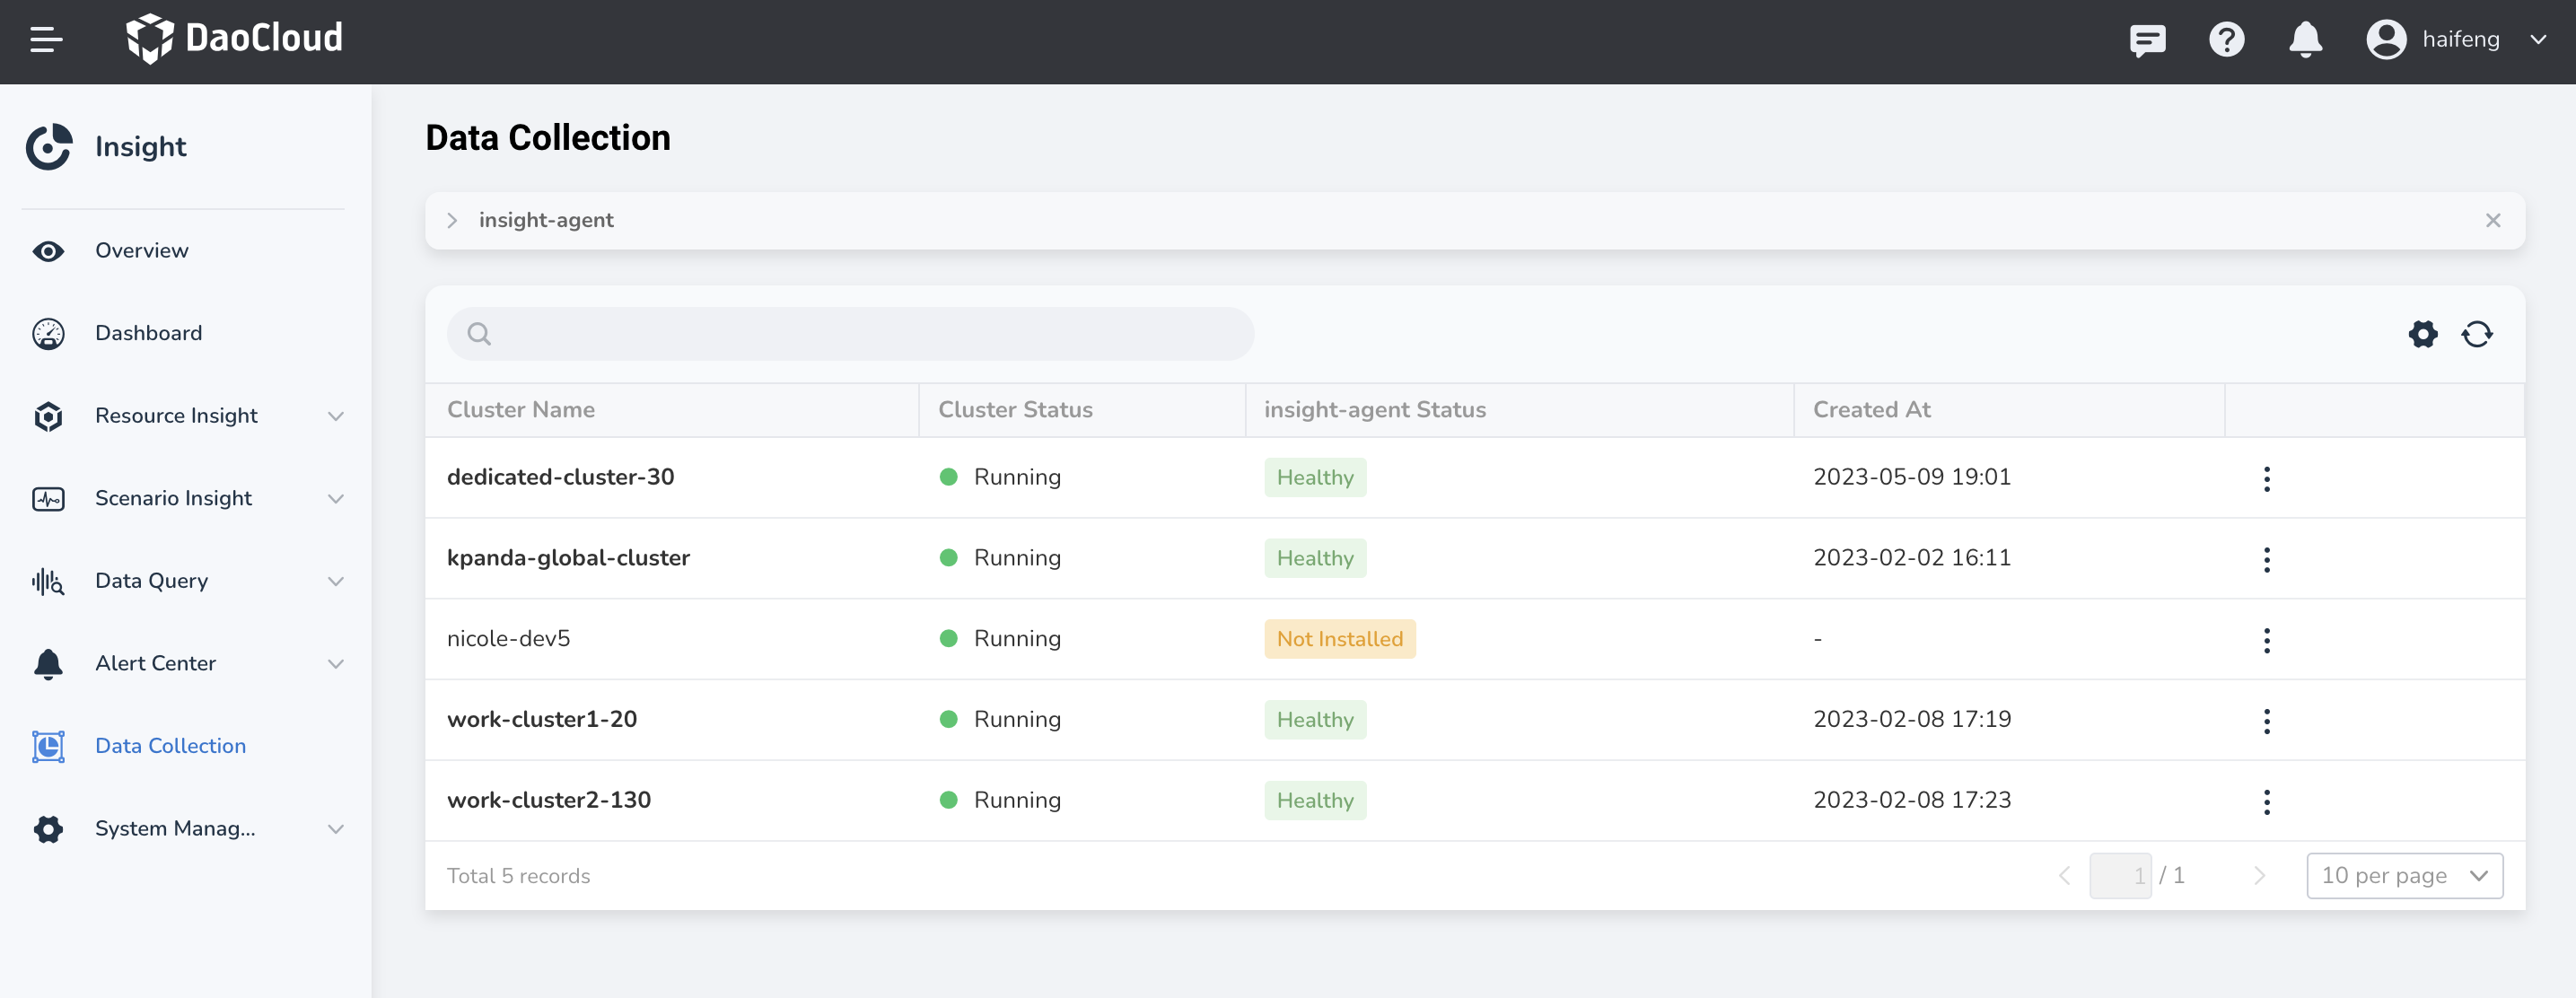
Select Data Collection on the left navigation bar to view the status of all cluster collection plug-ins.

-
Click a cluster name to enter the collection configuration details.

-
Click the link to jump to Container Management to create a Service Monitor.
apiVersion: monitoring.coreos.com/v1 kind: ServiceMonitor metadata: name: micrometer-demo # (1) namespace: insight-system # (2) labels: operator.insight.io/managed-by: insight spec: endpoints: # (3) - honorLabels: true interval: 15s path: /actuator/prometheus port: http namespaceSelector: # (4) matchNames: - insight-system # (5) selector: # (6) matchLabels: micrometer-prometheus-discovery: "true"- Specify the name of the ServiceMonitor.
- Specify the namespace of the ServiceMonitor.
-
This is the service endpoint, which represents the address where Prometheus collects Metrics. endpoints is an array, and multiple endpoints can be created at the same time. Each endpoint contains three fields, and the meaning of each field is as follows:
- interval : Specifies the collection cycle of Prometheus for the current endpoint . The unit is seconds, set to 15s in this example.
- path : Specifies the collection path of Prometheus. In this example, it is specified as /actuator/prometheus .
- port : Specifies the port through which the collected data needs to pass. The set port is the name set by the port of the Service being collected.
-
This is the scope of the Service that needs to be discovered. namespaceSelector contains two mutually exclusive fields, and the meaning of the fields is as follows:
- any : Only one value true , when this field is set, it will listen to changes of all Services that meet the Selector filtering conditions.
-
matchNames : An array value that specifies the scope of namespace to be monitored. For example, if you only want to monitor the Services in two namespaces, default and insight-system, the matchNames are set as follows:
-
The namespace where the application that needs to expose metrics is located
- Used to select the Service